send link to app
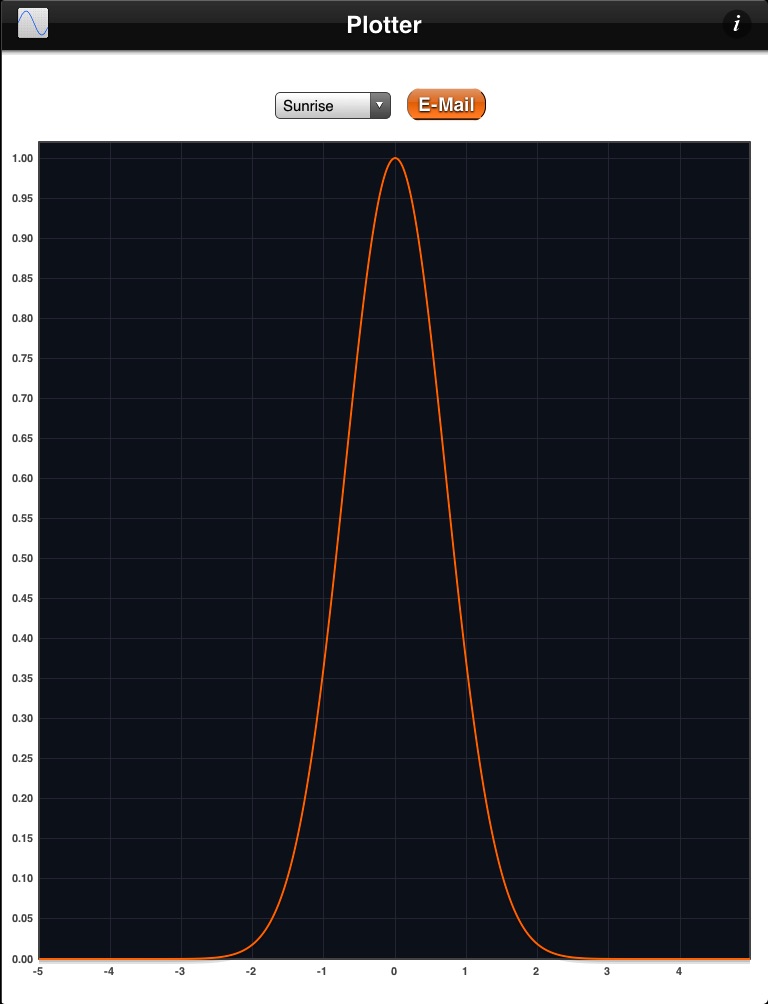
Plot graphs of functions. Enter your formula and the range you want to plot.
Features:
- By separating the formulas with semicolons you can draw more than one function.
- Tap the chart to flip through the themes.
- Save formulas for later use.
- E-Mail the formulas, charts and let others open them in the plotter web application.
- retina display support


